BRIDGE DECK TESTING IN A FRACTION OF THE TIME TYPICALLY REQUIRED BY CHAIN DRAG, RESULTS PRODUCED REFLECT THOSE TYPICALLY ACHIEVED BY CHAIN DRAG AND THE HUMAN EAR.
Combining a variety of methods to accurately identify the location and size of flaws in concrete bridge decks and other structural concrete structures.
- HAMMER SOUNDING
- CHAIN DRAG
- IMPULSE RESPONSE
- IMPACT ECHO
- NOVEL ANALYSIS TECHNIQUE
The deck acoustic response (DAR) is an automated bridge inspection method used to identify and quantify areas of subsurface degradation including delamination, debonding, and spalling. SoundDAR utilizes a novel analysis method that replicates the function of the human ear by detecting changes in frequency, amplitude, and relative energy distribution. In this way, it provides an automated NDE method similar to manual sounding at a fraction of the cost.
High Resolution
Video (HRV)
BDI pairs this service with other NDE techniques such as GPR and IR, but most importantly with HRV. HRV data results in a visual map of the bridge deck collected utilizing a 4k high-resolution video camera. The HRV camera is capable of capturing a full lane width of data per driving pass.
Data
Presentation
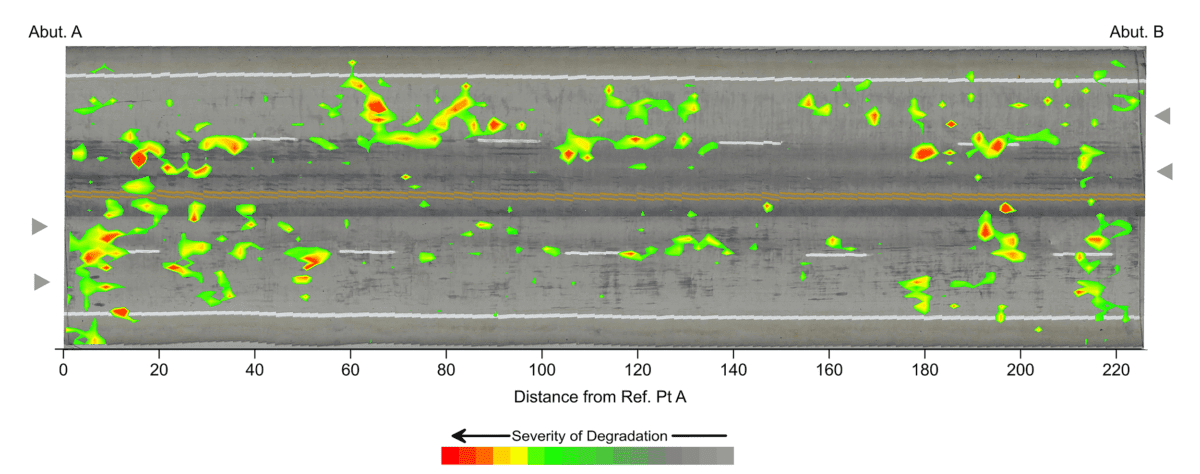
These results of HRV are provided in 4K resolution with overlaid SounDAR data identifying other physical features of the bridge deck such as debonding, patching, and delaminations.

SounDAR Data Provided in Contour Plot Fashion with Level of Degradation Severity
SounDAR Analysis Automation Sample
(sound on)
Bottom: This figure presents the final output of a SounDAR inspection overlaid on top of high resolution video (HRV) data. Degraded areas are presented on a severity type color plot that indicates relative degradation detected with SounDAR. SounDAR has 12 microphone / impactor pairs. The black dot in this figure indicates the microphone/impactor pair on SounDAR that corresponds to the top and middle data sets, while the other 11 green dots correspond to other microphone/impactors that were used to develop the rest of this plot. As the set of dots moves across this plot, this indicates that the SounDAR device was moving, and the location of the impact correlates with the data sets in the top and middle plots.
Top: The top plot presents the filtered time domain record of the data measured with SounDAR. The x-axis is time and the y-axis is amplitude of the dynamic response.
Middle: The middle plot presents a spectrogram of the filtered time domain data. Using a fast Fourier transform (FFT), the data is transformed from the time domain into the frequency domain. In this plot, the x-axis is still time and the y-axis is frequency. The intensity of the color indicates the amplitude within the frequency domain.
BRIDGE DECK TESTING IN A FRACTION OF THE TIME TYPICALLY REQUIRED BY CHAIN DRAG, RESULTS PRODUCED REFLECT THOSE TYPICALLY ACHIEVED BY CHAIN DRAG AND THE HUMAN EAR.
HOW CAN THE SOUNDAR TECHNOLOGY HELP WITH YOUR ASSET MAINTENANCE GOALS?


